
Tableau Desktop Introduction Training
2 days (10:00 AM - 5:00 PM Eastern)
$750.00
Register for a live online class.
Details
Subjects Covered
Prerequisites
Setup Requirements
Details
Course Details
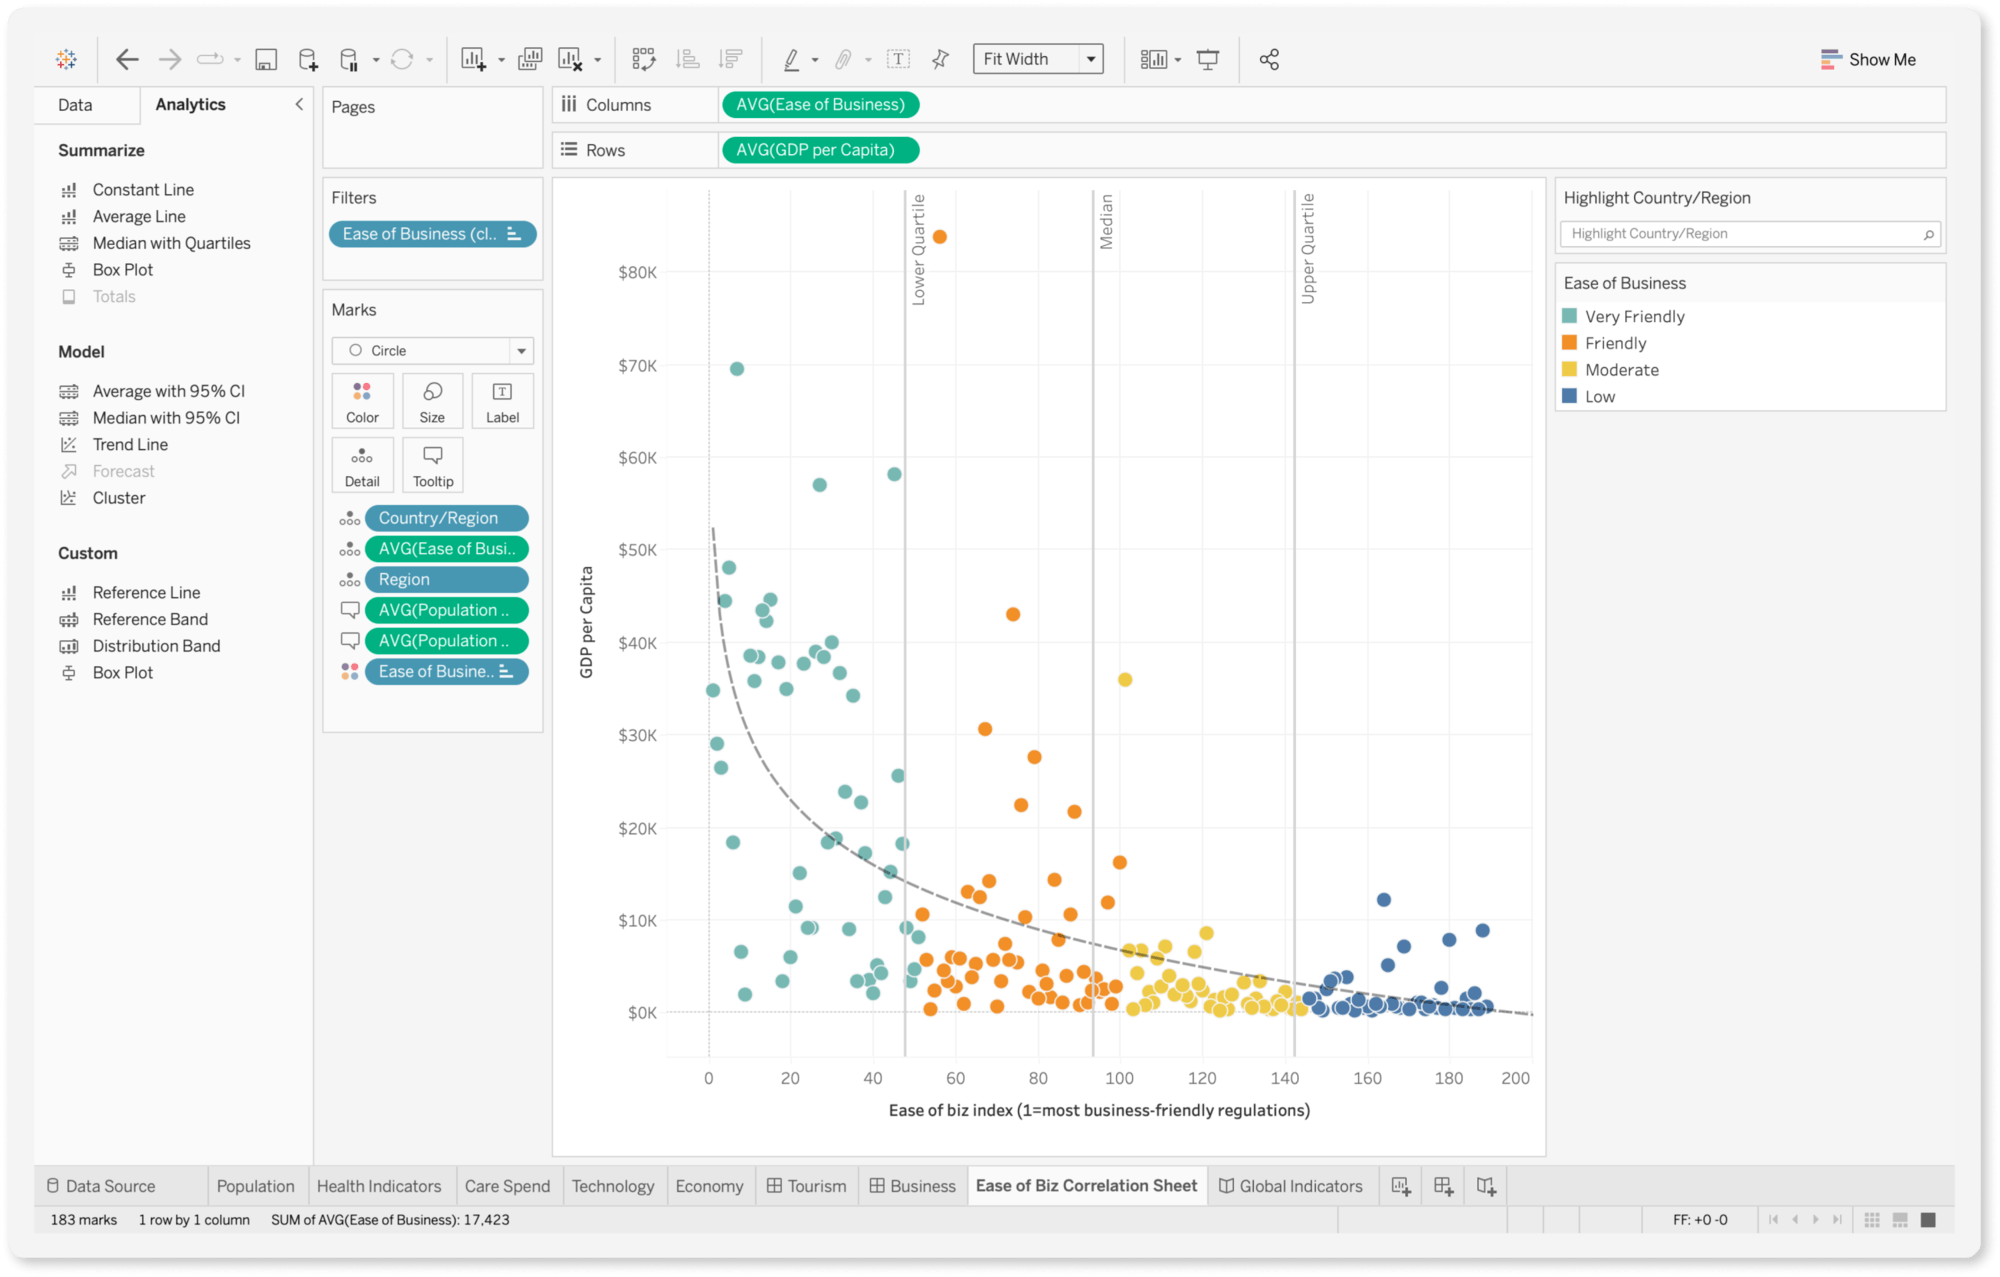
Tableau Introduction is a hands-on, beginner-friendly course designed to equip learners with the foundational skills needed to build effective and compelling data visualizations. Starting with an overview of Tableau products and the user interface, participants will learn how to connect to data sources, build interactive charts, and create dashboards that deliver insights at a glance. The course covers a broad range of topics—from understanding dimensions and measures, formatting views, and using filters, to working with geographic data and developing interactive dashboards and stories. Whether you're analyzing sales trends or building executive dashboards, this course provides the essential building blocks to confidently navigate and use Tableau for visual data analysis.
Subjects Covered
- The Tableau Environment
- Tableau Products
- What is a Data Visualization?
- The Viz
- The Start Page
- The Tableau Interface
- Workbooks and Sheets
- Navigating Workbooks and Sheets
- Connecting to Data
- The Role of Data in Tableau
- Static vs. Live Data Sources
- Types of Data Sources
- Establishing a Data Connection
- Editing a Data Source
- Data Source Page
- Data Grid vs. Metadata Grid
- Refreshing a Data Source
- What Happens When You Connect to Data?
- Creating a Visualization
- The Data Pane
- Data Types
- Changing Data Types
- Dimensions and Measures
- Tableau-Generated Fields
- Understanding Dimensions
- Understanding Measures
- Searching for a Field
- Understanding Shelves
- Building a View
- The View Area
- What is Show Me?
- Saving, Publishing, and Sharing
- Saving Visualizations
- Publishing Visualizations
- Saving Data Sources
- Location of Saved Data Sources
- Publishing Data Sources
- Chart Types and Uses
- Tabular Data (Crosstabs or Pivot Tables)
- Pie Charts
- Line Charts
- Bar Charts
- Heat Maps (Density Maps)
- Highlight Tables
- Treemap Charts
- Gantt Charts
- Bullet Graphs
- Scatterplots
- Types of Correlation
- Outliers
- Histograms
- Discrete vs. Continuous
- Discrete vs. Continuous
- Converting Fields Between Discrete and Continuous
- Using Totals and Aggregation
- Understanding Discrete and Continuous Time
- Convert a Measure to a Dimension
- Adding Visual Details
- Understanding Marks
- Marks Card
- Text Mark
- Shape Mark
- Bar Mark
- Line Mark
- Titles and Captions
- Legends
- Tooltips
- Tooltip Command Buttons
- Annotations
- Creating Annotations
- Formatting Annotations
- Formatting Basics
- Formatting a Workbook
- Themes
- Editing Axes
- Changing Axis Range
- Editing Tick Marks
- Formatting Fields
- Formatting Field Labels
- Formatting Numbers and Null Values
- Resizing Tables and Cells
- Working with Multiple Measures
- Working with Multiple Measures in a View
- Adding Individual Axes for Each Measure
- Creating Combined (Blended) Axis Charts
- Understanding a Dual Axis Chart
- Creating a Dual Axis Chart
- Organizing, Filtering, and Sorting
- Hiding Fields
- Data Properties
- Renaming Fields
- Creating Aliases
- Sorting Data
- Sorting Options
- Creating Folders
- Creating Hierarchies
- Using Hierarchies
- Drill Up or Down a Hierarchy
- Understanding Filters
- Creating Filters
- Applying a Filter
- Filtering Qualitative Data (Dimensions)
- Filtering Quantitative Data (Measures)
- Creating Groups
- Creating Sets
- Mapping Data Geographically
- Understanding Mapping Concepts
- Latitude and Longitude
- Working with Location Data
- Creating a Simple Map
- The View Toolbar
- Using Calculations
- Understanding Calculations
- Creating a Calculated Field
- Formatting Calculations
- Working with Functions
- Working with Aggregates
- Applying Quick Table Calculations
- Creating Dashboards
- What is a Dashboard?
- Building a Dashboard
- Dashboard Interactivity
- Creating Dashboards for Different Devices
- Dashboard Size Options
- Tiled vs. Floating Items
- Switching Between Tile or Float
- Creating Stories
- What is a Story?
- The Story Workspace
- Creating a Story
Prerequisites
Before Taking this Class
Participants should be comfortable using a computer and have a basic understanding of data concepts such as rows, columns, and types of charts. No prior experience with Tableau or data visualization is required.Setup Requirements
Software/Setup For this Class
Tableau Desktop
Onsite Training
Do you have five (5) or more people needing this class and want us to deliver it at your location?

